

Facebook Insights
I look at Facebook Insights every so often to see how well/poorly I am doing. If you are interested in such statistics, which you should be, this post will show you how to analyze your Facebook postings to give you a better “Insight” on how your fans will engage with your future content.
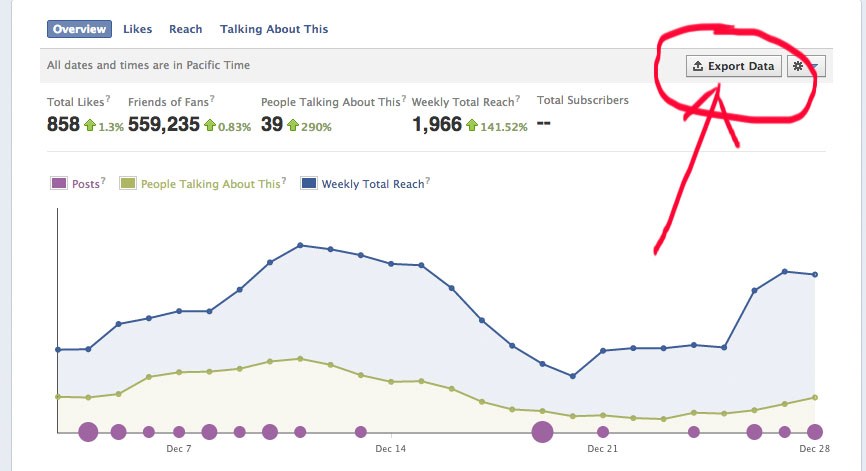
You can look at your Insights and get an immediate visual representation of how you are doing. The default is set to show the last 18 posts, but I recommend looking at your posts from month to month, so you can see your progress. You shouldn’t be measuring your success by the number of Likes you have. I’ve said this before…500 semi-engaged fans are great, but 100 engaged fans are better.
As you can see in the image above, you can export your data into a spreadsheet and really dive into the numbers. I’ll show you how to analyze them, and use that info to help you determine what type of posts you should be posting in the future. I exported data from Ask Big Questions, as I work with them on their social media strategy.
Once you click on Export, a window will pop-up that will allow to choose the date range, the format you would like the report in and the data type. I chose 12/1/2012-12/30/2012; Excel and Post Level Data.
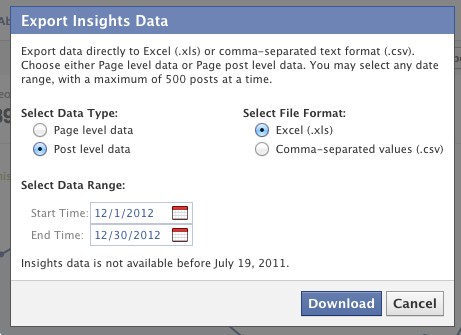
Hit download and your spreadsheet will download. Now this is where the fun starts. The spreadsheet has tons of numbers and fields. I’ll explain how you can use this data to cater your future Facebook posts. You can also use it to compare month to month statistics, or even year to year.
You can download this report and follow along with me, or you can download your page’s report. The Ask Big Questions report is available for download here. You’ll need to download it and not view it via Drop Box. Highlighted below are fields that I think are the most important as the spreadsheet a lot of fields.
NOTE: The lifetime of a post is 28 days. The numbers reflected are measured from 28 days after the post. Ex. If you post on January 1, 2013, the numbers will be calculated until January 28th, 2013.
Permalink – Link to the post if you want to look at it again
Post Message – What you actually posted.
Type – Was it a link, a picture, a video or a status update?
Posted – The date and time it was posted. This could be handy to see when the best time to post is if you see a correlation.
Lifetime Total Reach –
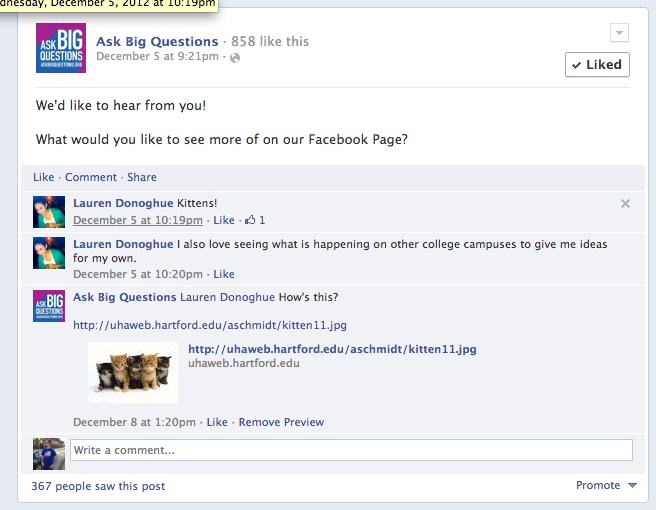
I sorted the spreadsheet by this field and this was the post that had the highest total reach in this data set (12/1/2013-12/30/12). Reach is determined by the number of unique users that saw your post (within the first 28 days). A question was asked, which evokes engagement. Need to increase your engagement? Try asking a question.
Lifetime Post Organic Reach – The number of unique users that saw your post in their newsfeed, ticker (newsfeed on the right side in the chat window) or by going to your page. For this post, the metric is 366. It is less than 367 because someone who is not a fan of Ask Big Questions saw this post.
Lifetime Paid Reach – As you can see, at the bottom right of the post, you can pay to promote. This metric shows how many people saw your posts because you paid. This post was not promoted, so the number is 0.
Lifetime Post Viral Reach – This spreadsheet is doing the math for you. The Viral Reach is 1 for this post, which is the difference between the number of fans who saw the post and the number of non-fans who saw it. Your goal should be to have a high number for this column.
Lifetime Post Total Impressions – Impressions are defined by the number of times this post was seen. One user can see the post multiple times, which is why the reach is lower. This post has 1015 total impressions, which is also the highest for this data set.
Lifetime Post Viral Impressions – This is the number of impressions that came from non-fans. this post only was viewed once by a non-fan. Keep in mind, that because 1 person saw it, doesn’t mean that they consumed it, it just means it was shown on their timeline. An important number to keep in mind is engaged users, which I will cover a little later. The post with the highest viral impressions was…
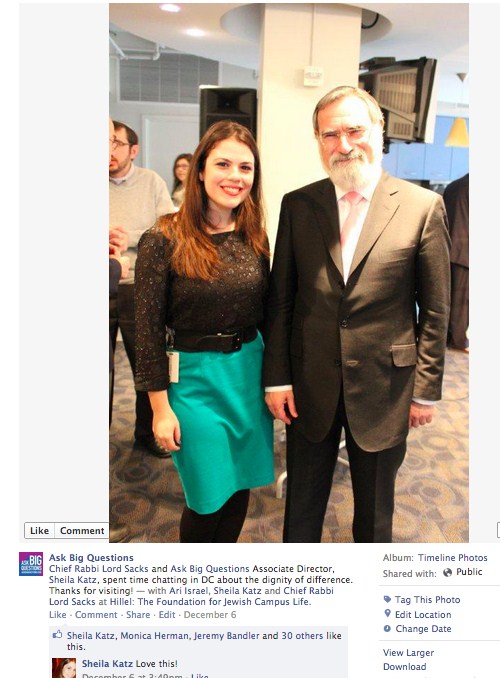
This image had 30 Likes, which is related to the number of viral impressions. Why did this photo do so well? It’s an image of a popular figure with the Associate Director of Ask Big Questions. Behind the scenes photos typically do well with fans. You’ll also notice that a few people are tagged in the photo. Facebook Pages cannot tag people in their photos, for spam reasons. A Facebook user can however, so switch to using Facebook as your personal account and tag away. You can only tag people that you are friends with on your personal account.
It is safe to say that another post like this will gain a similar engagement level.
Lifetime Post Engaged Users – This is my favorite number to look at. It tells you how many people, liked, commented, or clicked on your post. The above image with Sheila and Rabbi Chief Lord Jonathan Sacks had 96 engaged users, which is the highest in this data set. The next highest post had 74 engaged users, which you can see here.
Lifetime Talking About This (LTAT) – This number is important in that it shows how many stories were created by users interacting with your post. A story is a post that is added to the users timeline, which is desired because it shows friends of your fans how awesome your pages is. The LTAT of the Chief Rabbi Lord Sacks photo is 32, which is also highest for this data set.
If you have downloaded this spreadsheet or your own, you can see there are more numbers to analyze. This post was meant to be an introduction. Based on this short analysis, I would bet that posting questions and behind the scenes photos of famous people will get more engagement in the future.
You should be using these stats to dictate what your future postings should be. Your fans actions are telling you how they like to consume you, so listen to them.
You may have already known that pictures and questions will get you the most engagement, but these numbers back that up. You can also use these spreadsheets to compare your efforts from month to month.
Are you going to start using this data to cater your posts? Let us know in the comments.